> ## Documentation Index
> Fetch the complete documentation index at: https://www.activepieces.com/docs/llms.txt
> Use this file to discover all available pages before exploring further.
# Latency
> What Activepieces adds to a synchronous webhook, warm versus cold, so you can set expectations before building on it
A **synchronous webhook** holds the connection open until your flow returns, so the caller waits for the orchestration around your flow plus your flow's own work. These are floor numbers, slow paths included.
**Scope:** the recommended production setup (`SANDBOX_CODE_ONLY`, `AP_REUSE_SANDBOX=true`, one flow per worker), which self-hosted deployments and **dedicated Cloud workers** run. The shared Cloud freemium pool uses a different sandbox. See [Production Setup](/docs/install/configure-operate/production-setup).
## What to expect
| Situation | Caller waits |
| ------------------------------------------ | -------------------------------- |
| **Warm** (the normal case) | **\~0.2 s** |
| **Cold** (first request on a fresh worker) | **\~2 s** |
| **Under heavy load** (every worker busy) | **\~0.5 s** |
| **Timeout** (flow never responds) | 30 s, then the connection closes |
## Warm vs cold
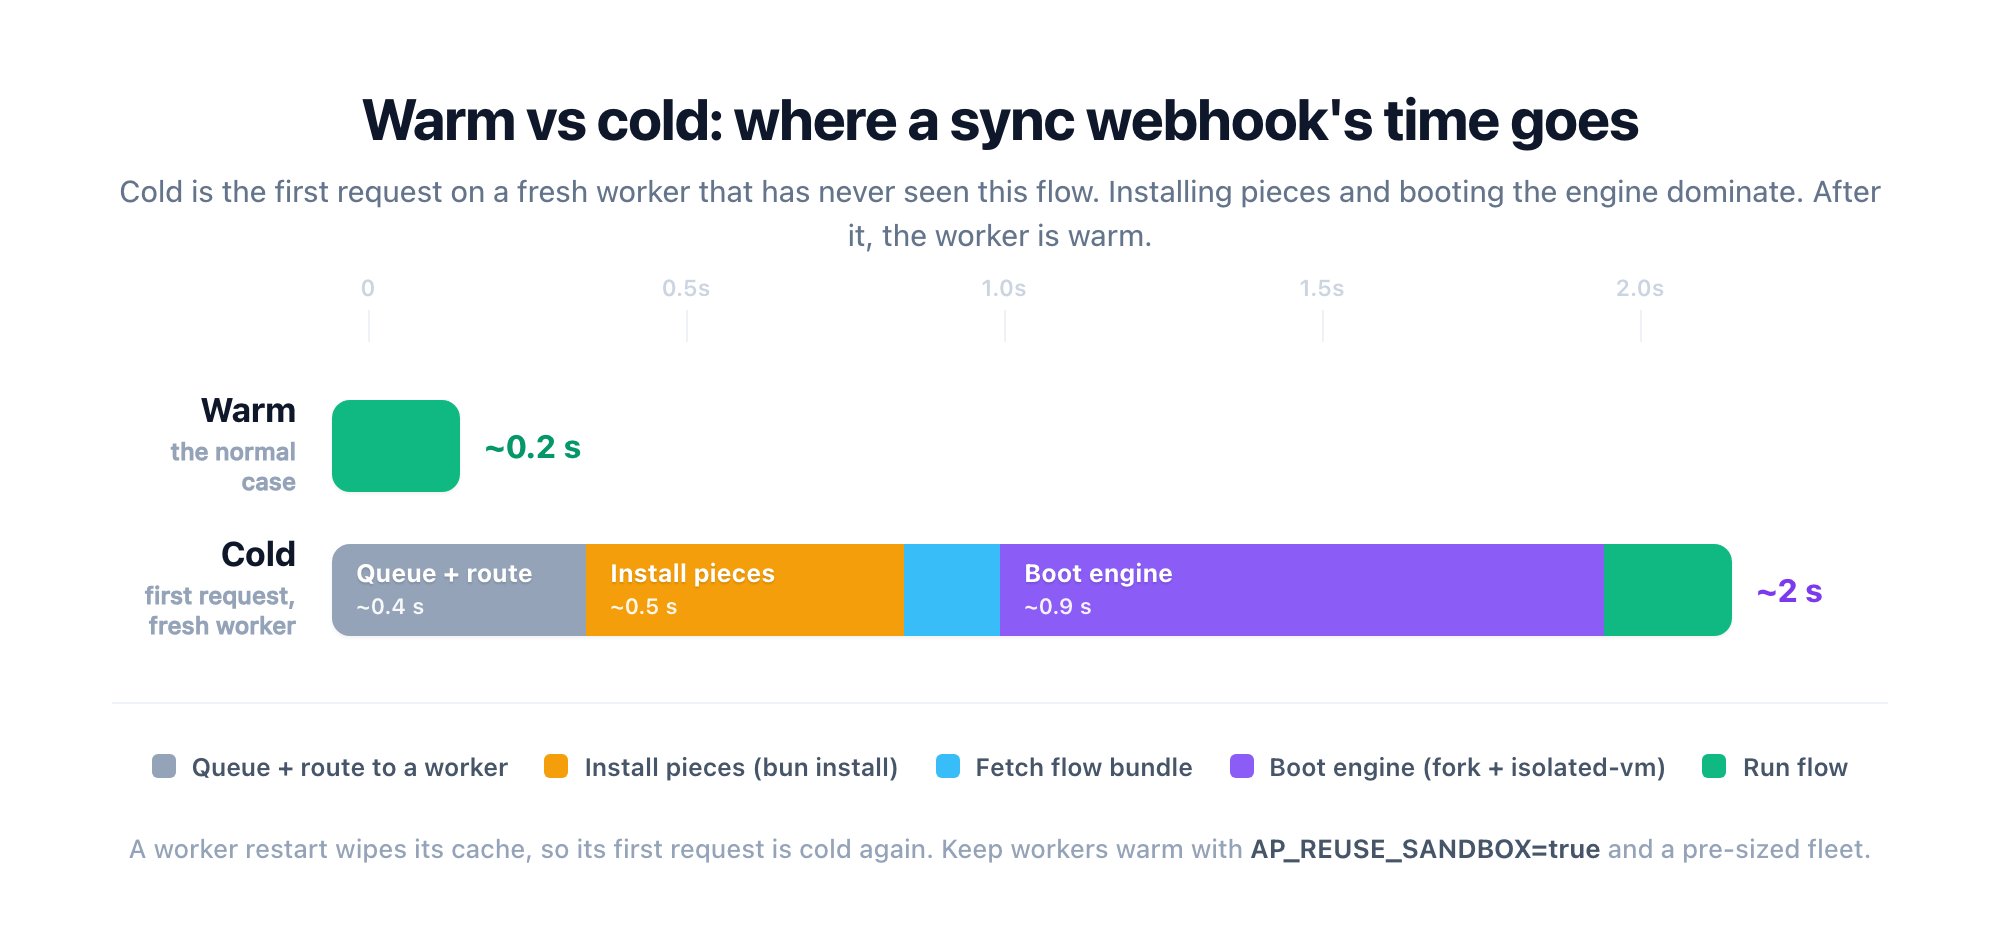 **Cold** means a worker that has never seen this flow: it installs the pieces, fetches the bundle, and forks an engine first. **Warm** reuses all three. You hit cold when:
* It is the first request after a deploy, restart, or scale-up.
* `AP_REUSE_SANDBOX` is off (then every request is cold).
* A burst exceeds your warm worker count. Each worker runs one flow at a time, so the surplus queues or starts cold.
Size **statically for peak** so a warm slot is always waiting. Autoscaling's boot lag cannot defend a 30 s sync budget ([measured numbers](/docs/install/architecture/autoscaling)). Cold starts are not Cloud-specific, they are how the engine boots, and you will see them anywhere.
## Per-run breakdown
Every run records where its wall-clock time went, shown as a four-phase bar. **To view it, open any run and hover the info icon next to the run's duration** ("Took") in the run header.
**Cold** means a worker that has never seen this flow: it installs the pieces, fetches the bundle, and forks an engine first. **Warm** reuses all three. You hit cold when:
* It is the first request after a deploy, restart, or scale-up.
* `AP_REUSE_SANDBOX` is off (then every request is cold).
* A burst exceeds your warm worker count. Each worker runs one flow at a time, so the surplus queues or starts cold.
Size **statically for peak** so a warm slot is always waiting. Autoscaling's boot lag cannot defend a 30 s sync budget ([measured numbers](/docs/install/architecture/autoscaling)). Cold starts are not Cloud-specific, they are how the engine boots, and you will see them anywhere.
## Per-run breakdown
Every run records where its wall-clock time went, shown as a four-phase bar. **To view it, open any run and hover the info icon next to the run's duration** ("Took") in the run header.
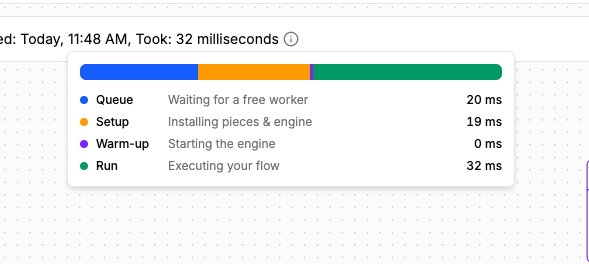 The phases run in order:
| Phase | What it covers | Warm | Cold |
| ----------- | ------------------------------------------------------------------------------------------------------------------------------------------------------ | ------------ | ---------------- |
| **Queue** | Waiting after the run is created until a worker picks it up and starts setup — contention (every worker busy) plus dispatch overhead. | \~0 | grows under load |
| **Setup** | Fetching the flow bundle and installing the pieces, engine, and code steps into the sandbox (provisioning). | \~0 (cached) | \~0.5 s |
| **Warm-up** | Forking the engine process, Node boot, `isolated-vm` init, and the socket handshake (engine boot). | \~0 (reused) | \~0.9 s |
| **Run** | Executing the flow's trigger and steps — the same number reported as the run's duration (**Took**). Your own work and third-party calls dominate here. | your flow | your flow |
Queue, Setup, and Warm-up are the orchestration around your flow; **Run** is the flow itself. On a warm worker the first three collapse toward zero — the reused sandbox is already booted, so Warm-up is \~0 — and the bar is almost entirely **Run**, which is why warm calls are dominated by your own work.
## Where the Run phase actually goes
For a flow that does real work — a step calling a third-party API — that outbound call dominates **Run**, and the Activepieces overhead is the smaller number next to it.
For a *bare* flow (no external calls), **Run is mostly persisting the run, not executing it.** A production run makes a fixed set of network round-trips to the app and object store, independent of step count:
* **Two log-backup writes to your object store (S3/GCS)** — an initial snapshot and a final one. With signed URLs on, each is a direct worker→object-store upload. On a warm in-region cluster this is the single largest slice of Run (measured \~45% of worker-busy time); on a distant or public object-store endpoint it grows proportionally.
* **A handful of worker→app callbacks** (send-response, run-log metadata) — each roughly one worker→app round-trip. Database and Redis touches ride inside these and are a few ms each.
Per-step progress callbacks fire only for **test runs in the builder**, not production webhook runs — so adding steps does not add a callback per step to a live run.
The practical consequence: a bare warm run's latency tracks your **object-store proximity** more than anything else. Keep the object store in-region and reachable over a private, same-zone path.
## Measured (warm)
Four-step flow (webhook, math, code in `isolated-vm`, response), single warm call, no contention:
| p50 | avg | p95 | p99 |
| ------ | ------ | ------ | ------ |
| 163 ms | 176 ms | 260 ms | 343 ms |
The same setup measures \~165 ms unloaded but \~505 ms under sustained peak: the app tier saturating, not the flow slowing. Always ask which load a figure was measured under. Throughput view: [Benchmark](/docs/install/architecture/benchmark).
## Reduce it
* **Keep workers warm:** `AP_REUSE_SANDBOX=true` plus a statically sized, always-on fleet.
* **Put the object store next to the workers:** a bare warm run spends most of its Run phase on two log-backup writes to S3/GCS. In-region, same-zone, private connectivity to the object store is the biggest lever on that overhead — a distant or public endpoint multiplies it.
* **Size for peak concurrency:** N concurrent requests need N warm workers ([sizing](/docs/install/configure-operate/production-setup#sizing)).
* **Fewer, heavier steps:** each step adds overhead.
* **Don't let a slow third party block the response:** use an async webhook and callback instead of holding against the 30 s ceiling.
The phases run in order:
| Phase | What it covers | Warm | Cold |
| ----------- | ------------------------------------------------------------------------------------------------------------------------------------------------------ | ------------ | ---------------- |
| **Queue** | Waiting after the run is created until a worker picks it up and starts setup — contention (every worker busy) plus dispatch overhead. | \~0 | grows under load |
| **Setup** | Fetching the flow bundle and installing the pieces, engine, and code steps into the sandbox (provisioning). | \~0 (cached) | \~0.5 s |
| **Warm-up** | Forking the engine process, Node boot, `isolated-vm` init, and the socket handshake (engine boot). | \~0 (reused) | \~0.9 s |
| **Run** | Executing the flow's trigger and steps — the same number reported as the run's duration (**Took**). Your own work and third-party calls dominate here. | your flow | your flow |
Queue, Setup, and Warm-up are the orchestration around your flow; **Run** is the flow itself. On a warm worker the first three collapse toward zero — the reused sandbox is already booted, so Warm-up is \~0 — and the bar is almost entirely **Run**, which is why warm calls are dominated by your own work.
## Where the Run phase actually goes
For a flow that does real work — a step calling a third-party API — that outbound call dominates **Run**, and the Activepieces overhead is the smaller number next to it.
For a *bare* flow (no external calls), **Run is mostly persisting the run, not executing it.** A production run makes a fixed set of network round-trips to the app and object store, independent of step count:
* **Two log-backup writes to your object store (S3/GCS)** — an initial snapshot and a final one. With signed URLs on, each is a direct worker→object-store upload. On a warm in-region cluster this is the single largest slice of Run (measured \~45% of worker-busy time); on a distant or public object-store endpoint it grows proportionally.
* **A handful of worker→app callbacks** (send-response, run-log metadata) — each roughly one worker→app round-trip. Database and Redis touches ride inside these and are a few ms each.
Per-step progress callbacks fire only for **test runs in the builder**, not production webhook runs — so adding steps does not add a callback per step to a live run.
The practical consequence: a bare warm run's latency tracks your **object-store proximity** more than anything else. Keep the object store in-region and reachable over a private, same-zone path.
## Measured (warm)
Four-step flow (webhook, math, code in `isolated-vm`, response), single warm call, no contention:
| p50 | avg | p95 | p99 |
| ------ | ------ | ------ | ------ |
| 163 ms | 176 ms | 260 ms | 343 ms |
The same setup measures \~165 ms unloaded but \~505 ms under sustained peak: the app tier saturating, not the flow slowing. Always ask which load a figure was measured under. Throughput view: [Benchmark](/docs/install/architecture/benchmark).
## Reduce it
* **Keep workers warm:** `AP_REUSE_SANDBOX=true` plus a statically sized, always-on fleet.
* **Put the object store next to the workers:** a bare warm run spends most of its Run phase on two log-backup writes to S3/GCS. In-region, same-zone, private connectivity to the object store is the biggest lever on that overhead — a distant or public endpoint multiplies it.
* **Size for peak concurrency:** N concurrent requests need N warm workers ([sizing](/docs/install/configure-operate/production-setup#sizing)).
* **Fewer, heavier steps:** each step adds overhead.
* **Don't let a slow third party block the response:** use an async webhook and callback instead of holding against the 30 s ceiling.